deckhand
An R package designed to support production of data heavy presentation packs (aka 'slide decks') in the Cabinet Office.
About this project
The {deckhand} package is bespoke wrapper around the {pagedown}
package’s R Markdown template that aligns with
the Cabinet Office’s corporate identity guidelines. It also provides helper
functions to incorporate {gt} output quality tables
and {ggplot2} charts/graphics.
The package has been ported by analysts working in other institutions including
the Ministry of Justice and the Natural History Museum. A generalised successor
to deckhand, {deckhand2} is in
development.
Improving “last-mile” reproducibility in analytical workflows
While much progress had been made in adopting the principles of reproducible analytical pipelines in the collection and processing of data in statistical and research projects the “last-mile” remained a largely manual process. Even where code-based approaches are used to produce the inputs for output tables and charts the development of the final products takes place manually using standard office productivity software such as Excel and PowerPoint or the Google Workspace equivalents.
The continued reliance on manual steps in the last mile of production is common practice because a wider range of individuals are often involved in the writing and consultation on commentary and narrative elements of the analytical product, and typically these are either managers or non-technical colleagues without the skills or software available to edit code. Similarly, there are often needs to change and amend slide decks at the last minute, especially text, again having something that managers and non-technical colleagues can edit is often desired.
R Markdown is a common output method for
analysts using R, while it can render content into
PowerPoint documents
there are significant limitations in their design and styling. The
{officer} package also provides
methods for working with
Powerpoint documents
and improves the ability to design and style documents over that offered by R
Markdown, but still does not give full control to the end user.
In 2019 the {pagedown} package was released,
which brought the paged.js JavaScript library into an
R Markdown format. Paged.js works with the
paged media module of the Cascading Style
Sheets (CSS) specifications to make it easy to represent traditional page-based
media on the web. This provides a significant advantage for the development and
styling of page based output from R Markdown documents.
Standardising page layouts, tables and charts
A central part of the {deckhand} package is to combine the paged media aspects
leveraged by {pagedown} with another CSS layout engine, the
grid layout.
In combination this gives us a powerful framework for structuring and designing
individual pages.
The {pagedown} package provides “poster” examples that show this working for
individual pages, but {deckhand} extends this to support multi-page documents
where each page can have a defined layout. Within the {deckhand} CSS classes
are the definition of 19 standard layouts that match the layouts in the Cabinet
Office Analysis & Insight team’s PowerPoint template for data heavy reports.
The benefit of this approach is to simulate the “slide masters” functionality
within PowerPoint/Slides where a user can select and work with a pre-defined
layout template for a page.

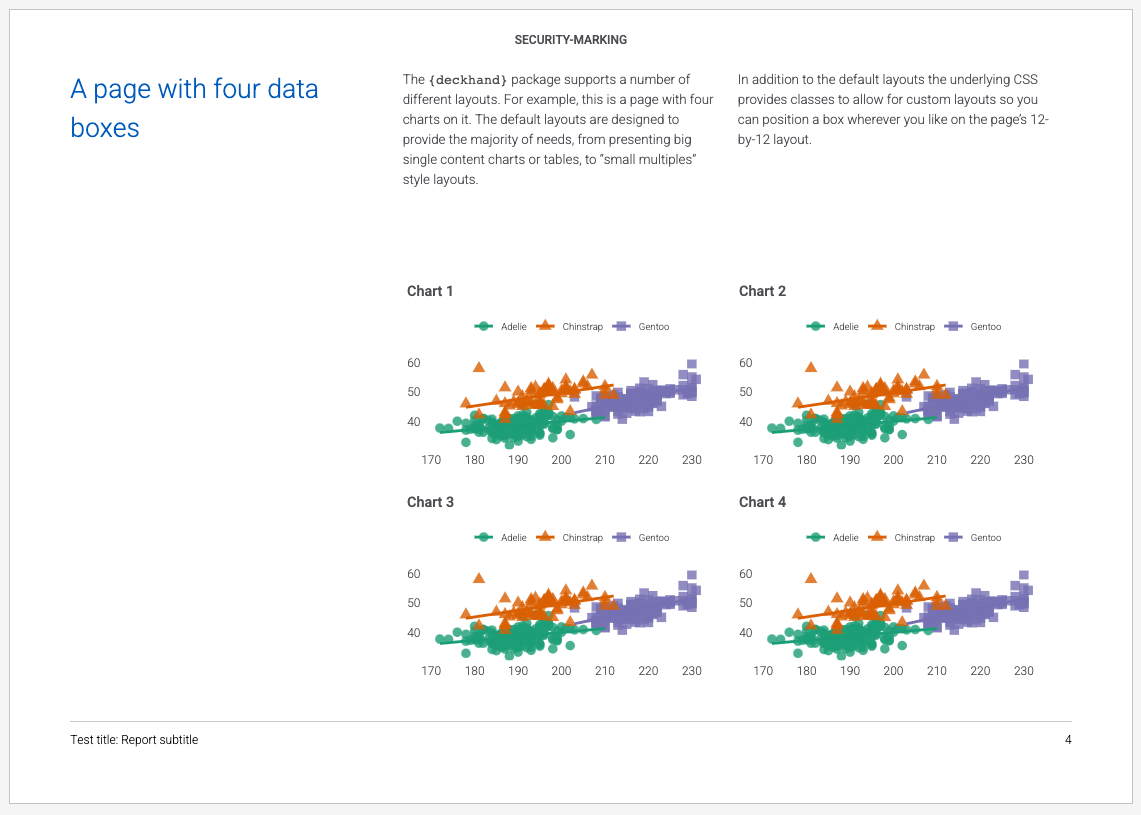
Examples of the {deckhand} standard layouts
In addition to page layouts, {deckhand} provides a number of features to support
users to adhere to the Cabinet Office’s corporate identity guidelines. The
Cabinet Office corporate colours are supported in both the CSS styles and are
available to end users as a vector of hex colour codes from within R, which
supports charting. There is a standardised chart theme for
{ggplot2} charts to provide consistency
across charts within the end document.
To support output tables, there is a function that integrates works with the
{gt} package to provide users with the power of
{gt} within the CSS styling set out by the {deckhand}. It provides some
convenience functions to allow you to: provide unique styling (via CSS) of an
individual table, highlight the highest and lowest cells by column or row,
removing header rows, and using a smaller text size (for tables with a large
number of rows).
Enabling collaboration with non-technical colleagues and stakeholders
While not specific to the {deckhand} package, in making use of the package a
process was developed for working easily with non-technical colleagues. This was
particularly helpful for the drafting of the narrative elements of the “slide
deck”. Traditionally this would be done by providing these colleagues with
access to the PowerPoint/Slides document so that they can edit text boxes. But
in using R Markdown it is more difficult for non-technical colleagues to work
with. Instead a shared Google Sheets document was set up where each row relates
to a separate page (with a unique identifier) and columns are used to specify
the content of each page’s title and constituent text boxes.
| page_id | page_title | page_text |
|---|---|---|
| summary | Our analysis shows X causes Y | Lorem ipsum dolor sit amet, enim sem. Vel elementum mi phasellus… |
| descriptive1 | A third the sample has outcome Y | Lorem ipsum dolor sit amet, enim sem. Vel elementum mi phasellus… |
| descriptive2 | Half the sample has characteristic X | Lorem ipsum dolor sit amet, enim sem. Vel elementum mi phasellus… |
| crosstab1 | Most of those with X have outcome Y | Lorem ipsum dolor sit amet, enim sem. Vel elementum mi phasellus… |
| regression1 | Controlling for other factors X has a strong influence on Y | Lorem ipsum dolor sit amet, enim sem. Vel elementum mi phasellus… |
This sheet is then saved as a CSV file and used by the analysts developing the report to programmatically insert the narrative text into the resulting document.