Civil Service People Survey
Measuring, reporting on and analysing employee engagement in the UK Civil Service.
The Civil Service People Survey is the annual employee attitudes survey of the UK Civil Service, and has a focus on measuring levels of employee engagement. I was responsible for the initial development of the survey’s data collection and analysis methodology (2009-2010) and subsequently lead the delivery team (2011-2015). More recently, I have gone on to support the team with automation, data engineering and reproducibility (2019-2022).
Developing an analytical framework for employee engagement in the Civil Service
Prior to the Civil Service People Survey’s inception in 2009 each government department and agency was responsible for running its own employee attitudes survey. This meant surveys were run using different question sets, a different times of the year, with differing frequency, and with different analytical techniques. This hindered efforts to make comparisons between organisations; whether to better facilitate sharing of good practice across government or to hold senior officials to account for the management and leadership of government departments and agencies.
The principal aim of the CSPS was to unify the collection of employee attitudes from the 100+ organisations that make up the UK Civil Service. Many institutions already ran their own survey, but with their own questions and run by different suppliers, therefore creating a challenge to develop a harmonised questionnaire that integrated aspects from these different pre-existing questionnaires.
The project also had an aim to introduce the concept of employee engagement to the UK Civil Service, influenced in part by the Engaging for Success report published in July 2009 (commissioned by the Department for Business, Innovation and Skills, written by David MacLeod and Nita Clarke). Engaging for Success did not introduce a specific set of questions for measuring “employee engagement” or for including in a staff survey. As a result there was a need to a specific measure for the CSPS.
Prior to the existence of the CSPS most departments and agencies outsourced all aspects of survey delivery, including questionnaire design, to external suppliers. While fieldwork and general reporting would continue to be outsourced, following experience delivering HMRC’s staff survey I joined the Cabinet Office’s programme team as a social research specialist to develop a distinct methodology for the CSPS.
Some external suppliers had already started to measure employee engagement in the employee surveys they offered to departments and agencies. However, there were concerns from stakeholders about consultancy language in the questions such as “going the extra mile” or “discretionary effort”, there was also conceptual mixing where some questions were measuring emotional affective aspects while others were measuring behavioural intentions. I developed a revised set of questions that had improved relevance for the public sector.
In addition to defining employee engagement there was a need to explore and identify the relationship between it and the other aspects of the questionnaire. This was achieved by using factor analysis, firstly to confirm employee engagement as a distinct concept that is separate from other measures, but also to group the remaining questions into themes. Regression analysis, presented to staff and managers as “key driver analysis”, was then conducted to review the correlation between the “engagement index” with each of the factors12.
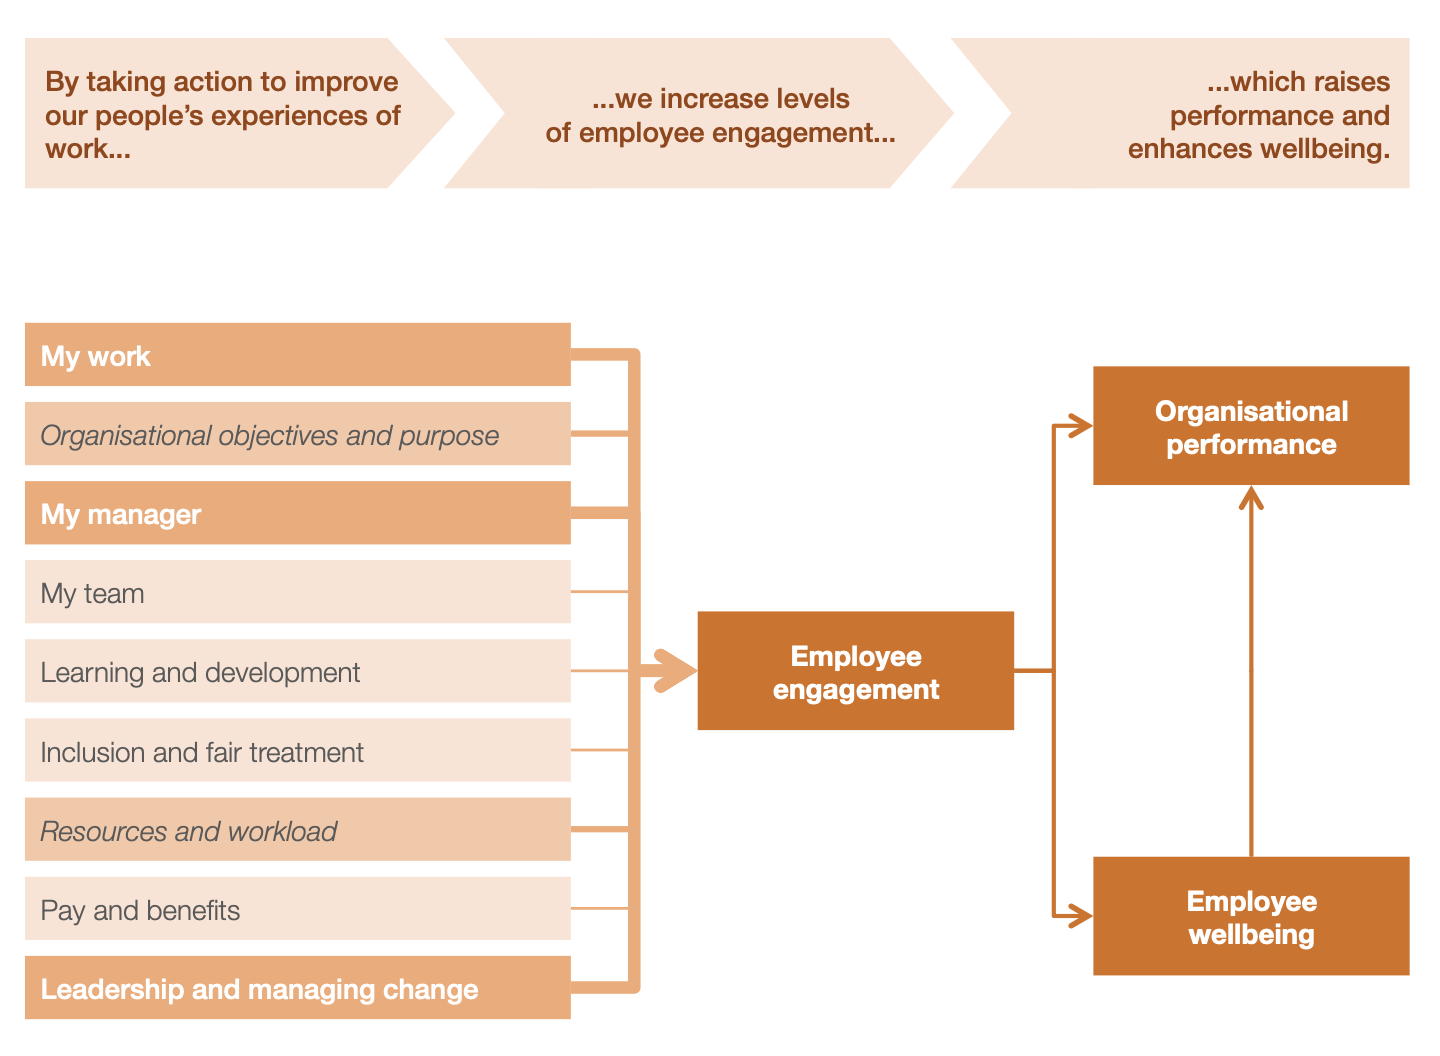
The analytical framework of the Civil Service People Survey
This was communicated to managers and staff through a flow diagram that showing illustrating a conceptual framework for employee engagement that showed the “driver” relationship between the survey factors/themes and the engagement index as well as the consequential relationship between employee engagement and outcomes such as organisational performance and employee wellbeing.
In addition to “simple” numerical representation of the engagement index, an “engagement segmentation” was developed to provide an alternative way to think about employee engagement by considering the different patterns of how people respond to the engagement index questions. This segmentation was developed using cluster analysis, identifying 7 different groups ranging from “disengaged” respondents that answered all 5 questions negatively through to “engaged” respondents that answered all 5 questions positively. This segmentation was based on data from the first results of the 2009 survey, I then developed a set of algorithms to allocate respondents to one of the 7 segments in future.
Analysing and reporting results
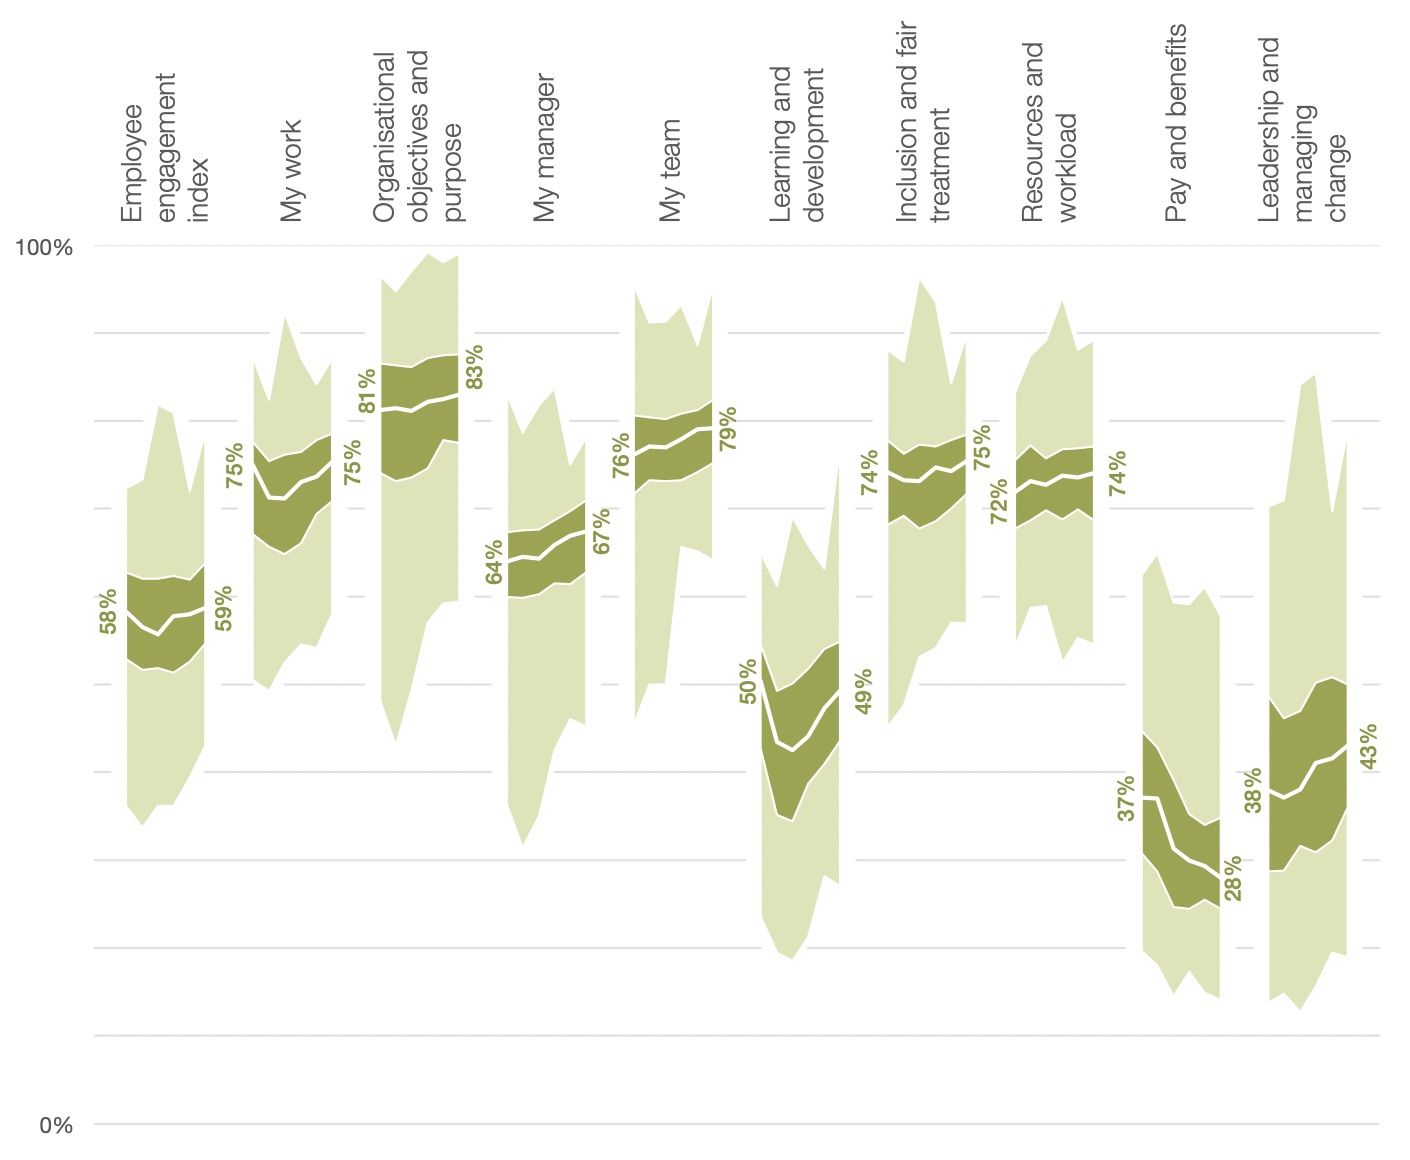
Each year the CSPS is able to produce reports for over 10,000 teams across the Civil Service, providing an overview of the survey results for leaders, managers and staff across all levels of the organisation. I oversaw two iterations of the design of these reports, ensuring that these presented a large volume of information – question results, aggregate scores (engagement index, and theme scores), time-series and benchmark comparison, driver analysis results – in simple, coherent and understandable ways3.
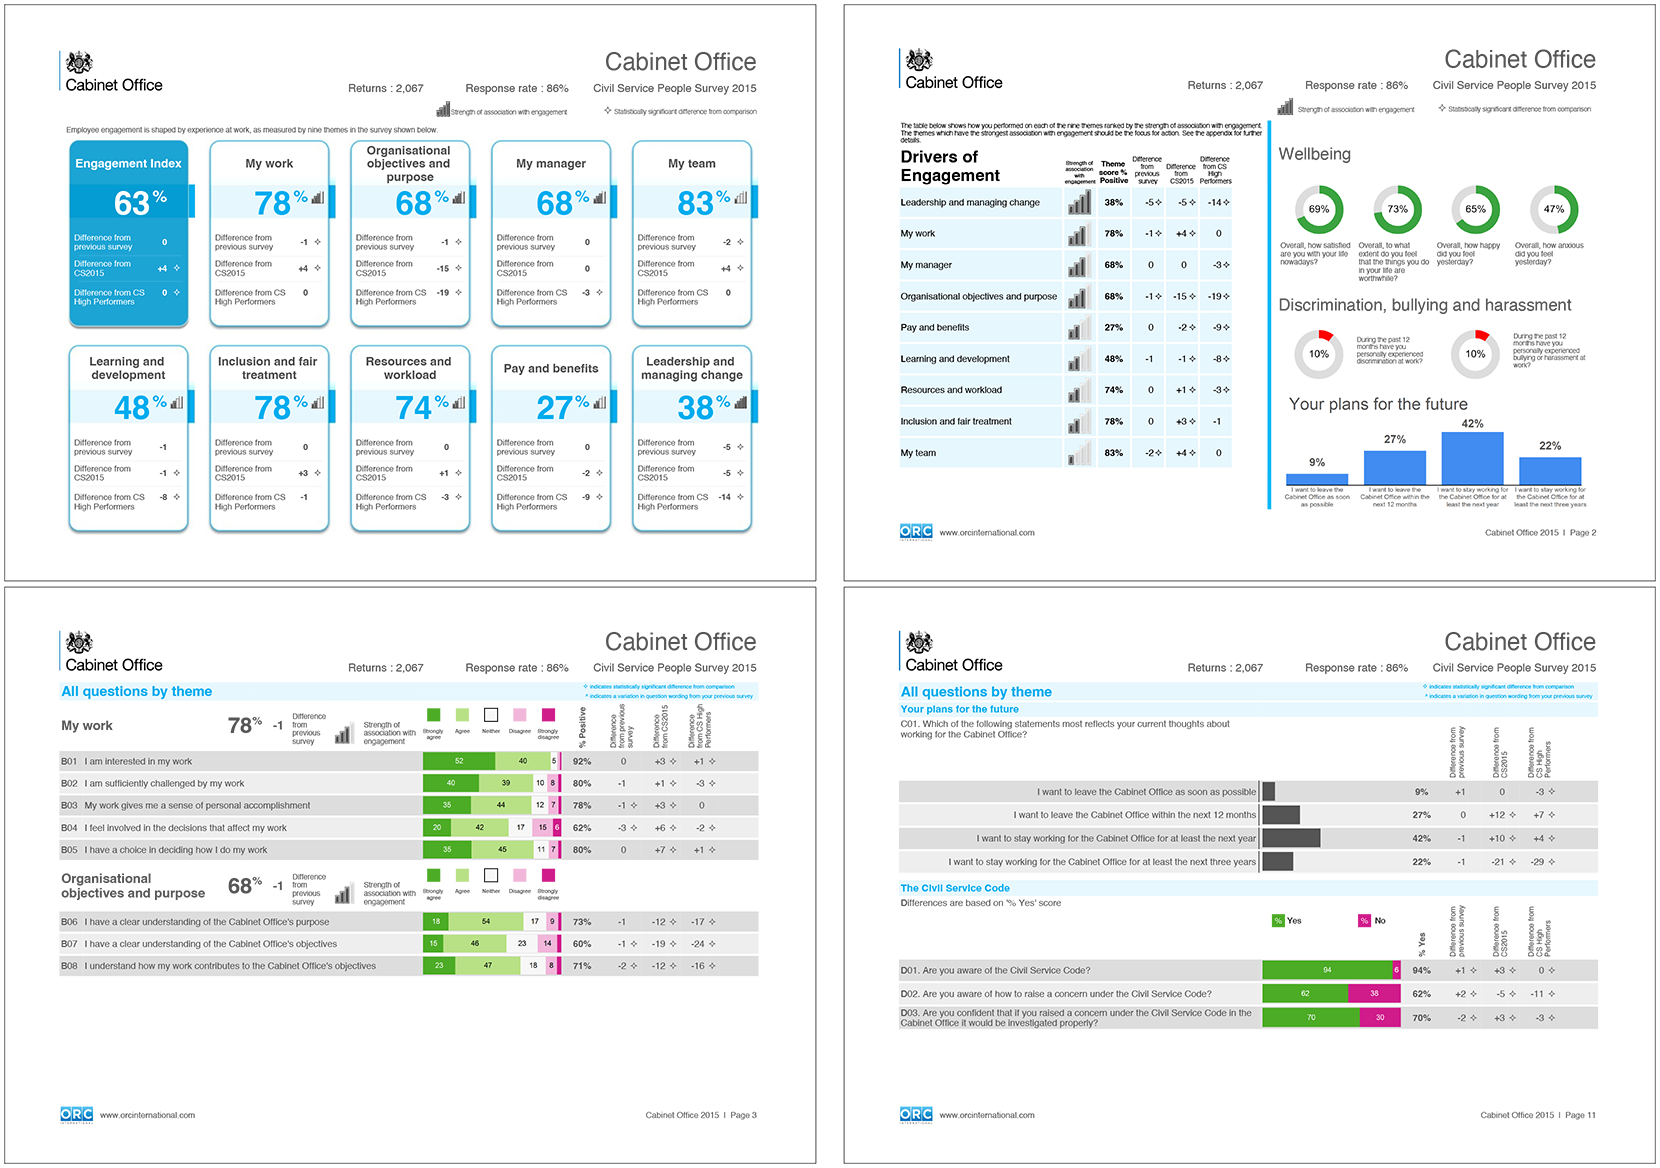
Sample of the organisation and team ‘highlights’ reports (2015-2019 design)
I was responsible for cross-government results analysis and briefing these results to the Civil Service’s most senior leaders. This analysis was both to summarise overall results but also focussed analysis for specific cross-government issues or areas of interest, for example:
- descriptive analysis of results for particular groups of civil servants such as for the Permanent Secretary disability diversity champion or the Government Economic Service;
- correlation and time-series analysis of units headed by Directors General to support career management and progression of top civil servants;
- correlation analysis of the relationship between engagement levels of Senior Civil Servants and junior staff;
- regression analysis of the relationship between engagement levels and sickness absence statistics;
- qualitative analysis of open-text comments for specific groups of respondents, such as disabled civil servants or Senior Civil Servants that said they wanted to leave their organisation within the next 12 months;
- natural language processing (NLP) modelling of open-text comments to develop topic and thematic structures of survey comments to inform policy makers looking at civil service and organisational reform.
From 2010 through to 20144, I also produced an externally published report each year summarising both the headline results as well as key analytical findings that had been developed for senior leader briefings – read the 2010, 2011, 2012, 2013 and 2014 reports5, and the associated technical guide (2014 version5).
Automation, data engineering and reproducibility
My most recent work with the Civil Service People Survey (from 2019-20224) has focussed on supporting the survey’s coordination and analytical team in the Cabinet Office to adopt automated approaches to their analysis of the survey. In these activities I worked with and mentored a reproducible analytical pipelines specialist that I had helped the team recruit.
The first automation project was to validate the PDF reports produced by an external supplier and check for errors. This involved developing processes to extract figures from the reports (taking account of subtle variations in the layout of reports based on the hierarchy level of the unit). The extracted figures were then compared to separate figures that had been computed independently of the supplier, and any discrepancies flagged. Comprising both direct survey results for the relevant group of respondents but also comparative figures each PDF report contains hundreds of figures. The time taken to develop the extraction process and automate it to run all 10,000+ reports was quicker than the previous approach that manually checked just a small sample of reports.
In 2020 the People Survey team switched suppliers away from a service delivered by a market research agency to a service provided by a cloud survey platform. A by-product of this switch resulted in a significant amount of post-survey data processing moving in-house to the Cabinet Office team. Together with the team’s reproducibility specialist, we developed an approach to clean and process the survey data to ensure no loss in fidelity in the information available between years, this included:
- cleaning data from the ~10,000 paper survey responses that had been input by a third-party data capture agency, as the cloud platform could not process questionnaires completed on paper;
- calculating derived variables that relied on responses from multiple questions,
which could not be done in the platform, such as:
- combining routed questions on detailed ethnic groups, locations and occupations into a single variable, or the National Statistics Socio-Economic Classification;
- calculating variables such as the engagement index and theme score which aggregate numerical values from input questions;
- mapping values from the organisation specific grade/payband questions into a the common cross-Civil Service grade structure;
- developing disclosure control routines to apply secondary suppression and thus minimise the residual risks that an individual respondent can be identified in the cloud provider’s online dashboard tools.
This data cleaning process was revised and improved in the course of the delivery of the 2021 and 2022 surveys. For example, ahead of the 2021 survey a process was developed to derive additional variables on gender identity following the alignment of the survey with the Census 2021 questions on sex and gender.
The cloud platform did not provide a mechanism to easily replicate the previous approach to driver analysis, using linear regression, to give individual teams (of an appropriate size) their own driver analysis6. I explored the feasibility of an “offline” process to calculate these models that could be run by the central team and produce one-page drive analysis reports for each team, or figures that could be uploaded to the cloud platform’s dashboard visualisations. I also reviewed the feasibility of reintroducing the segmentation analysis and uploading this to the cloud platform. Unfortunately, while both the driver analysis and segmentation could have been run by the central team with little additional overhead, and even integrated into the cloud platform’s dashboards, this proposal was rejected by senior managers.
I helped the team improve the quality and reproducibility of their central
reporting to senior stakeholders such as briefings to Permanent Secretaries and
HR Directors or reports for diversity and professional networks. This work
developed into {deckhand}, an R
package I have written. I also developed a
prototype of an interactive website
for the team, based on the govukhugo
project.
The “driver analysis” approach previously used by the successful delivery consultancy was a linear regression of the mean score across the engagement index questions to the mean scores of the questions in each theme defined by the factor analysis. This method ignores multicollinearity issues associated with the inter-item correlation between questions. For example this analysis would often show a negative regression coefficient for the mean score for the “my manager” theme, contradicting research findings about the importance of good management by your direct supervisor. I instituted a revised methodology that instead used the orthogonal factor scores, which by their design have very low correlation with each other, so as to measure the relationship of the underlying latent variable representing the factor with the engagement index. ↩︎ ↩︎
As part of my MSc thesis I explored the potential for further revising the methodology for the “driver analysis” to reconsider the engagement index input from a mean score to an ordinal variable (by cutting the engagement index distribution into quintiles) and use multinomial logistic regression instead to explore the relationship between the index and the factor scores. ↩︎
A particular challenge was to find a simple way to convey the results of the driver analysis. This is based on linear regression analysis, but unless you are highly technical the coefficients are not easy to understand. The external contractor had traditionally used a method presented the coefficients as a percentage, but the methodology was flawed and difficult to communicate. Instead, I instituted the adoption of a system of symbols that replicated the concept of mobile phone signal bars, where high regression coefficients were represented by a set of “full bars” and coefficients, lower regression coefficients were represented by reducing number of signal bars, and coefficients that were not statistically significant were represented with a symbol indicating “no signal”. This worked as a communication method because people were very familiar with the concept of signal bars, the explicit coefficient values are not that useful to end users but rather it is the relative importance of the coefficients to indicate where managers and leaders should focus action to improve employee engagement levels. ↩︎
At the end of 2015 I left my role leading the CSPS delivery team; read more about my career history and experience. ↩︎ ↩︎
The 2010 to 2013 results as well as data publications for these years are available from UK Government Web Archive, while the 2014 report and data is available from GOV.UK. Data for 2015 onwards is also available from GOV.UK via the Civil Service People Survey Hub. ↩︎ ↩︎
As discussed above1, the robustness of the “driver analysis” used by the Civil Service People Survey was improved early in the development of the survey to use a factor scores approach to reduce issues associated with multicollinearity. The cloud platform is unable to replicate this approach using linear regression and factor scores. The approach recommended by the platform provider is to provide “driver analysis” based on the pairwise correlation of survey questions and the engagement index. This is presented as helping managers and leaders which individual questions to target, however this is arguably too narrow a focus, and while it might improve specific question scores it reduces the impetus and incentive to consider more holistic and multi-faceted responses that might be identified if action is targetted around on the broader underlying themes exposed by the facto analysis. Moreover, this pairwise question approach ignores the problem of multicollinearity and the inter-relationships between survey questions i.e. that although for presentation purposes they are grouped in one particular theme an individual question actually influences multiple themes in the underlying orthogonal factor structure. ↩︎